Market Review - Q3 2020
The 3rd Quarter was another strong quarter in the markets recovering off of the dramatic drop in February and March with the Total Market Index up over 9%, although September experienced a decline of 3.74%, following the best August for the markets in over 30 years. There continues to be a massive gap this year between “Growth” and “Value” companies as well as Large vs Small, although much of the difference in Growth vs. Value has been the health & success of technology-driven companies through the lockdown rather than specifically investor preference. We have continued an overweight to Growth in the stock portion of the majority of our client portfolios.

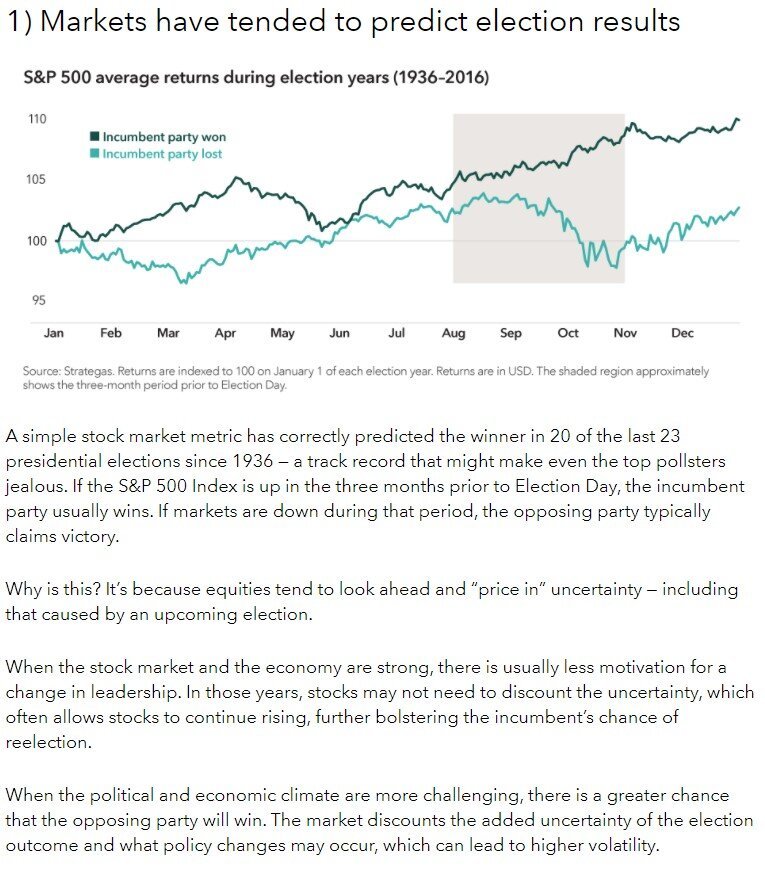
Those numbers will be watched closely with October results as the markets have been relatively accurate historically in predicting whether the incumbent party or the challenger party wins the election based on the market’s returns in the 3 months leading up to the election. The S&P closed at 3294 on August 3 and is at 3464 as of October 9. Like everything this year, though, it feels like a caveat is in order with COVID and the unique shutdown-induced recession we have experienced this year. From American Funds’ “How Elections Move Markets in 5 Charts” from our Market/Outlooks page:
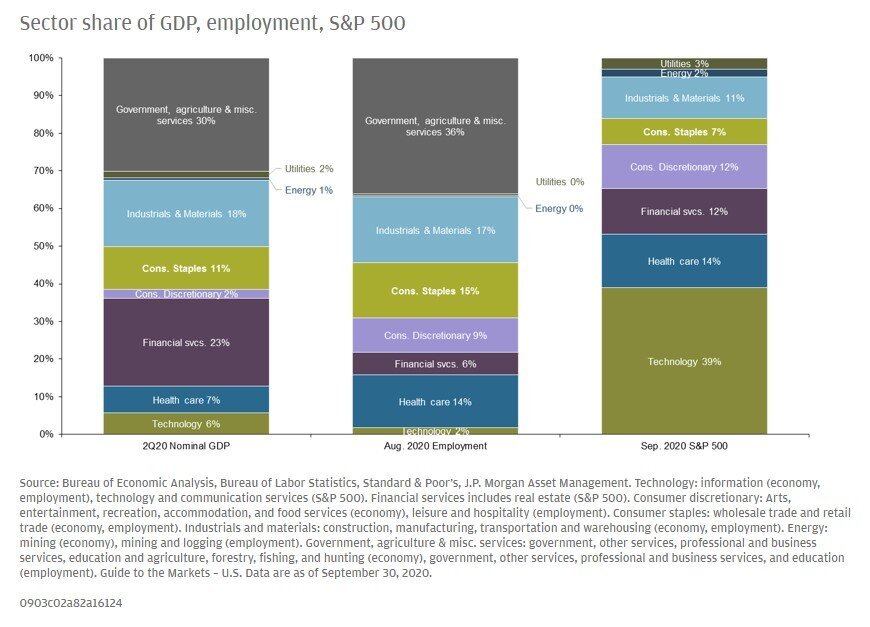
This is a helpful article for understanding why there can be what feels like a disconnect between “the economy” and “the markets” in a year like this where the markets recovered strongly while “the economy” was seemingly in disarray with unemployment etc. amidst the shutdown. The percentages of what makes up our GDP and Employment picture look quite different in certain key areas from the make-up of the S&P 500. Those differences and understanding what was impacted positively and negatively from the shutdown go a long way in explaining the different outcomes this year. Technology, which has thrived, currently makes up 39% of the S&P currently, while only making up 6% of GDP and 2% of payroll employment. Government, agriculture, and miscellaneous services that make up 30%+ of GDP and Employment are not reflected in the S&P and things like Industrials, Materials and Consumer Staples (more impacted through the shutdown) have a larger representation in GDP and Employment than they do in the markets.